
Several of the example displays use the autotrans test, which simulates an automobile transmission. In the Test Sessions form’s Edit tab, select the autotrans test and the Auto Create test session. If the real-time host does not have an RCIM and FBS installed, select the Soft Timer scheduler.
In the Run/Playback tab click on the Run button to begin running the test.

This simulation has two input points: brake, which takes a value from 0 to 1500, and throttle, which takes a value from 0 to 100. It has three output points: eng_rpm, gear, and speed_mpg. None of these are connected to any actual hardware. Instead, we connect them to virtual hardware in the HMI displays.
The next several subsections will examine sample displays that use this test. To open each display file, select Tests → HMI Display... from the menu bar or HMI Display... button on the Road Map or Test Sessions forms. To play with editing sample displays, open the HMI Builder form and select File → Open Display... or click on the Open Display button.
This display emulates a car’s dashboard, brake and gas pedals.

The widgets are placed on top of a background image that give the display a degree of photo-realism. Without the background the display would look like this:
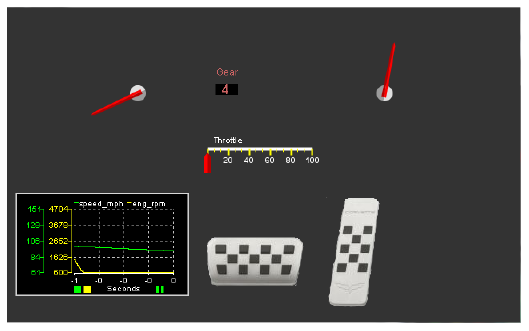
The tachometer and speedometer are implemented as simple Gauge widgets with the scale, arc, and value disabled in the visual properties since the background image provides these for us. These gauges are connected to I/O points eng_rpm and eng_mph respectively. See Gauge.
The gear indicator is actually two separate widgets. The word Gear is displayed with a Static Text widget. The gear number is a Numeric Value widget with the colors and font tweaked and connected to the I/O point gear. See Static Text and Numeric Value.
The throttle indicator/control is a Linear Gauge widget. User input is enabled, so you can click and drag on the indicator to change the value. It is connected to the I/O point throttle. Observe that when you press the gas pedal, the throttle indicators moves to 100, then back to 0 when you release the pedal, reflecting the values set by the gas pedal. See Linear Gauge.
The break and gas pedals are Action Button widgets. Each has two images, one for normal (when it is not pressed) and one for it being pressed. The action assigned to the buttons is sendpressrelease. This uses the two values specified in the parameters. For the gas pedal, this is 100 and 0. The 100 is sent to the throttle variable when the button is pressed, and 0 when it is released. See Action Button.
As an exercise, open this display in HMI Builder, select the gas pedal, change the parameters setting to 50/0, and launch the edited display. Observe how the throttle indicator now goes up to 50 instead of 100 when you press the gas pedal and how the speed doesn’t increase as rapidly.
A y Vs Time Plot widget graphs speed and rpm for the previous half second. As an exercise, select the plot and change the Number of Data Points to 5000. Observe how this now gives you the previous 5 seconds.
This display mostly demonstrates a number of different Bar Graph widget configurations. See Bar Graph.
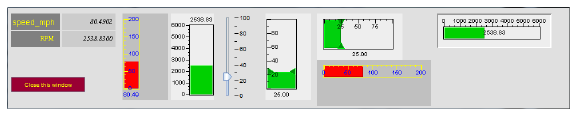
The table in the upper left corner is actually four separate Static Text and Numeric Value widgets with contrasting background colors set. See Static Text and Numeric Value.
Note how the position of the value text and the scale can be placed in different locations within the Bar Graph widgets. Some of the bar graphs have user input enabled, allowing the user to drag triangular indicators to another value. The widget on the far right has a border effect turned on, giving it a three dimensional appearance.
As an exercise, let’s make some modifications to the left- and right-most bar graphs above. Open autotrans-bar.swdb in HMI Builder and select the left-most bar graph. In the properties table find Bar Width under the Visual Properties heading and change the value from 25 to 30. This will make the graph wider so that the text doesn’t run up against the right edge. Also under Visual Properties, find Labels to Display and change it from 5 to 3. The only labels displayed now are 0, 50, and 100. Change Start Label from 0 to 50. Now we’re only displaying the intermediate labels. The labels at the extremes, 0 and 200, are not displayed.
Select the right-most bar graph now. The labels are a little crowded, so we’re only going to display a label every 2000 rpm. First, change Labels to Display from 7 to 4. Notice now that only 0 through 3000 are labeled. Change Label Spacing from 1000 to 2000, and the full range from 0 to 6000 is labeled again, every 2000 rpm.
The Slider widget, just to the left of center, is similar in appearance and functionality to the Bar Graph and Linear Gauge widgets, though it isn’t as flexible in how it can be configured. See Slider.
This display illustrates the use of background images, color zones, and LED indicators.
When you open this display in HMI Builder, several of the widgets display as black boxes with a white X through them. This is because the default value SimWB assigns to the associated variable (gear) is out of the widgets’ range. As an exercise, click on the one of the black widgets to select it. On the right side of the screen change the field labeled Value to 1 and click on the Set button. This will set gear and will cause the widgets connected to that variable to display normally. Try the other values (2, 3, and 4).
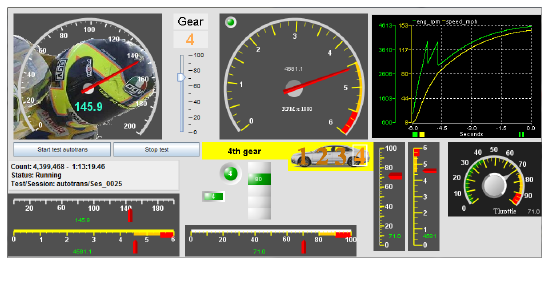
Unlike audi_dash.swbd, the speedometer in this display uses its own background image instead of relying on a background image for the whole display. In this case, the scale is not part of the image, but is drawn by SIMulation Workbench.
As an exercise, Select the speedometer in the upper left corner and change Number of Labels to 21 and Label Spacing to 10 to put a label on every major tick instead of every other one.
The Action Button widgets below the speedometer illustrate the ability to configure a display to be able to start and stop its associated test. As an exercise, select the Start test autotrans button and add ,timer to parameters to have the test use the software timer instead of the RCIM and FBS. The Test Status Display widget below that shows the status of the running test.
The Linear Gauge in the bottom left corner shows the rpm in thousands. As an exercise, change it to label every 500 rpm in hundreds of rpm. First, in Visual Properties, change the Number of Labels to 13 ((6000-0)/500+1), and the Label Spacing to 500. Then in Expected Value Range, change the Scale to 0.01. The value of the connected variable is multiplied by the scale factor to determine what value to actually display in the widget, but note that Label Spacing and Start Label are specified in terms of the unscaled actual value of the connected variable.
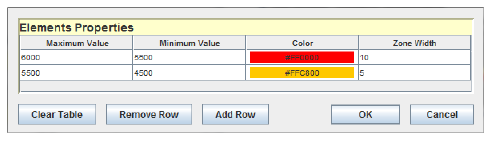
The color zones can be used to convey information about a value, such as that it exceeds the specifications of the simulated transmission. Note how the limits, color, and width of the zone can be specified in the Elements Properties table.
Color zones can also be specified for Gauge (top center) and Knob (bottom right) widgets as illustrated in this display.
The stack of five rectangular LED widgets in the lower center portion of the display are all connected to the I/O point throttle, but each is configure to react differently to the throttle’s value through its State Value Table, as illustrated for the center LED widget here (see LED):

If the value of throttle is less or equal to 40 (the Associated Value column), then it displays as gray and has no text. If it is greater than 40, but less than or equal to 60, then it will light up as green with the number 60 displayed on it. If the value of throttle is greater than 60, but less than or equal to 100 it displays as gray with no text again. If the LED widget is clicked on when it is in the first or third state, it will set throttle to 60 (the Send Value on Click column). Since each LED widget is connected to a different throttle range, as you drag one of the throttle controls up or down, you’ll see successive LED widgets light up, and none of them light up at 0.
The gear number is presented in a number of different ways. To the left of the stack of LED widgets described above are two LED widgets that are connected to the I/O point gear and light up different colors depending on which of the four values that point can have.
Above these is a Text Table widget (see Text Table). This widget can display different text with different colors and different background colors depending on the value of the associated variable.
To the right of that is an Image Table widget (see Image Table). This is like the Text Table except it displays an image instead of text for different values. In this case, the widget has an image of a car in its background, and four different images containing the highlighted gear numbers that are selected and superimposed on top of the background image for each gear value.
This display demonstrates ways of using buttons to set a variable to a value. The buttons will modify the throttle I/O point in the RTDB. In order to see the effect of changing the variable a pair of Numeric Value widgets in the upper left corner show the throttle and engine rpm setting and a Table of Values widget on the right side shows the values of several variables. Some of the widget variables are mapped to model variables instead of I/O points.

The top pair of buttons are Action Buttons (see Action Button) configured to send a value when clicked on. Click on the left and right buttons and see the throttle change between 0 and 100.
The button on the middle row is a Toggle Button. It switches between two states each time it is pressed. Each state sends a different value and puts its own value in the connected variable. Click on it several times and watch the value of throttle change between 0 and 100.
The bottom button is an Action Button, but it is configured to send one value when it is pressed, and another value when it is released. Click on the button but continue holding the mouse button down. The throttle variable will be set to 80. Release the mouse button and the throttle button will be set to 20.