Plots the values of variables against time. See Add to Charts.
Columns
Selects the number of charts per row. Charts are re-tiled when this setting is changed.
Auto Tile
Causes the charts to be re-tiled when the window is resized. Each chart is resized to the same height and widths are distributed evenly on each row.
Always on Top
Keeps the charts window on top of other windows.
Demonstrate 
Opens a short video clip that demonstrates the basic workflow of this window.
Help 
Opens this section of the manual.
New Page
Creates a new tabbed page. Charts are always added to the currently selected page.
Rename Page
Opens a dialog to rename the currently selected page.
Tile Pages
Re-tiles the charts on all pages. Each chart is resized to the same height and widths are distributed evenly on each row.
Options
Sets options on the chart whose title bar is highlighted. See Options.
Bandwidth
Amount of network bandwidth being used to get the chart data from the real-time host, located in the lower right hand corner. This includes graphs in HMI Display windows too.
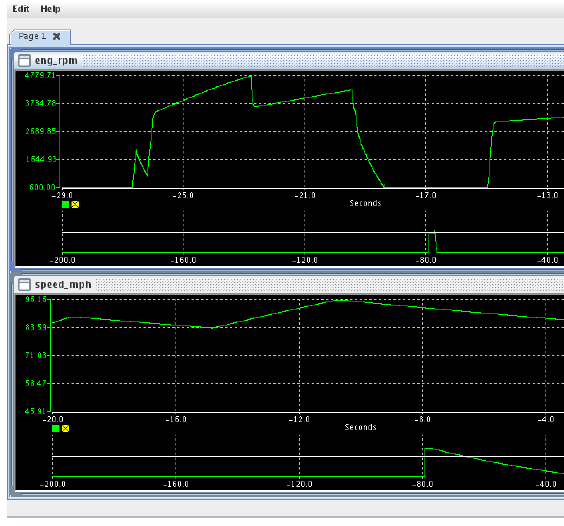
Each chart is held in an internal frame that acts somewhat like a regular window.
Title Bar
Shows the name of the variable being charted.
To rearrange charts, click and drag on the title bar to move the chart to a new location. The page will dynamically be re-tiled when charts are moved about.
To move a chart to another page, click and drag on the title bar and move the pointer to the page’s tab.
Maximize
Enlarges the chart to occupy the entire page. Click on the button again to normalize its size.
Close
Closes the chart. The remaining charts will be re-tiled.
Resize
Individual charts may be resized by clicking and dragging on the frame’s border. Adjacent frames will be moved or resized to make room.
Color coded scales for the CVT or Alt value (green and yellow, respectively, by default).
By default, each y-axis is autoscaled. To set a manual scale, click on the top and/or bottom of the y-axis and enter a number in the text box that pops up. Use the variable control buttons to re-enable autoscaling.
To specify a different C language format string for a y-axis scale, click on the axis between the top and bottom values and enter a new format string in the text box that pops up.
Options may also be use to modify the y-axis’ settings.
x-Axis
Time scale. The negative numbers indicate time extending into the past. The main graph and the zoom control each have their own scale.
To specify a different C language format string for the x-axis time scale, click on the axis and enter a new format string in the text box that pops up.
Options may also be use to modify the x-axis’ settings.
Color coded buttons for controlling the CVT and Alt value plots. See Current Value Table and Alternate Values.
To turn off a plot, click on the corresponding button. It will have an X drawn in it and the corresponding plot (including y-axis scale) will go away. Click on it again to bring the plot back.
To turn autoscale back on after manually setting the scale by clicking on the top or bottom of the y-axis, right click or control-click on the corresponding button. Autoscale may also be set through Options.
Pause
Pauses plotting the chart. Press again to resume plotting. The data sent while plotting is paused is lost and will not be plotted when plotting is resumed.
Hide Zoom Control
Hide’s the zoom control, allowing the main chart to use the full height of the frame. Click on it again to bring the zoom control back.
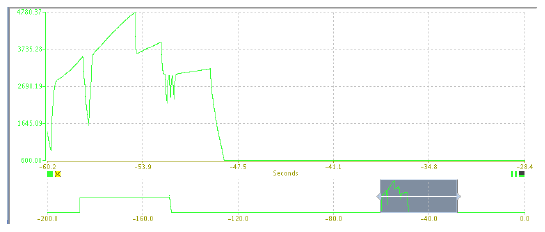
Zoom Control
Smaller graph below the main graph that displays (by default) ten times as much time. The portion of the zoom control graph that is displayed in the main graph is highlighted. This highlighted portion is called the selection window.
To adjust the range of time in the zoom control that is selected, and thus displayed in main graph, click on the left or right edge of the selection window and drag left or right.
To slide the whole selection window to a different range of times, click on the interior of the selection window and drag it left or right.
If the chart is resized to be too small to display the zoom control, the zoom control is hidden and the main graph will show the full time range.
Pressing the Options button or right clicking on the graph area of the chart will bring up the Options dialog.

Changes to options are visible in the chart immediately.
Value Selection
Selects whether the below settings operate on the graph of the CVT values or the alternate values. See Current Value Table and Alternate Values.
Auto Scale
Selects whether the range of the y-axis scale is determined from the observed minimum and maximum values, and adjusted dynamically as smaller or larger values are encountered, or the range is set to user selected values. See Maximum and Minimum below, and Variable Control Buttons,
Show Axis
Selects whether the y-axis and scale are displayed or not.
Maximum
Maximum value on the y-axis scale. The user may set this manually if the Auto Scale setting is turned off. See y-Axis.
Minimum
Minimum value on the y-axis scale. The user may set this manually if the Auto Scale setting is turned off. See y-Axis.
Format
C language format string for the floating point values of the scale labeling the y-axis. See y-Axis.
Axis Ticks
Number of labeled tick marks on the y-axis scale, including the minimum and maximum endpoints.
Plot Color
Color of the axis, button, and plot for the CVT or alternate value. See Color Chooser Dialog. The chart does not display the new color until the color chooser dialog is closed.
# of Data Points
Number of data points that are plotted. This determines the amount of time plotted on the x-axis.
Time Axis Color
Color of the x-axis and text. See Color Chooser Dialog. The chart does not display the new color until the color chooser dialog is closed.
Font
Font used for all text in the chart. See Font Chooser Dialog. The chart does not display the new font until the font chooser dialog is closed.
Time Format
C language format of the scale on the x-axis.
Time Axis Ticks
Number of labeled tick marks on the x-axis scale including the minimum and maximum endpoints.
Background Color
Background color of the chart. See Color Chooser Dialog. The chart does not display the new color until the color chooser dialog is closed.
Copy to All Charts
Copies the current (possibly modified) settings of the selected chart to all other charts and closes the Options dialog.
OK
Closes the Options dialog leaving the selected chart with all changes made.
Cancel
Reverts the selected chart to its original settings and closes the Options dialog.