The resources used by a simulator test consist of the executable programs and the Real-Time Data Base (RTDB) that must be created and configured before you can create tests and run test sessions. Once these have been created, you can create a test and assign those resources to it. When the test has been created, you can create test sessions with different run-time parameters and run them.
Once a test is running, you can invoke the Real-Time Viewer or use the Human-Machine Interface (HMI) Builder to build a custom HMI Display to monitor or interact with the running test in real time.
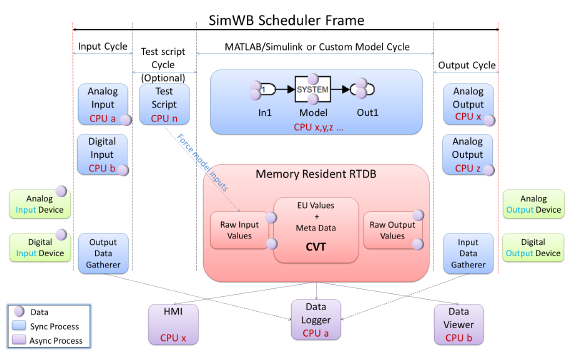
The following figure illustrates how a simulation cycle is performed. All components communicate via the RTDB by mapping to this shared memory area in order to be able to pass information to each other.
The sections below discuss the components of SimWB in detail.
The RTDB contains all the information needed to read, convert, write and store the variables for a simulation, as well as their values. For signals connected to physical hardware devices, the RTDB also holds the hardware mapping information. The mapping information is specific to each type of hardware device. The RTDB also contains engineering unit (EU) conversion functions for analog values, override flags, values, and raw unit values.
An API provides functions to map the RTDB into the process addressing space and to set or get the values of any RTDB items (see Application Programming Interfaces (APIs)).
There are three main components of the RTDB: meta data, hash table, and current value table (CVT):
Meta Data
Holds information about each RTDB variable, but not the data value directly:
• hardware mapping information
• engineering unit information
• description
• point type
• ‘C’ language type
• raw value type
• offset into the CVT (Current Value Table)
• meta flags
• default value
• alternate value (see Current Value Table and Alternate Values)
• raw value
Hash Table
Memory resident table that maps variable names to specific RTDB records.
Contiguous area of memory containing engineering unit (EU) values for RTDB variables. This area of memory can be mapped as a ‘C’ structure by multiple processes to gain direct access into real-time database values without knowledge about the structure of the database and with no need for a special API to set or get values. This ‘C’ structure is automatically mapped within the Simulink model address space. The header file corresponding to this ‘C’ structure is created automatically when saving the RTDB from the GUI.
Note
The names of the RTDB variables must be valid ‘C’ language identifiers: an alphabetic character or underscore followed by any number of alphabetic characters, underscores, or digits.
The test script is an executable program created by the user. It provides the ability to manipulate the RTDB every model execution cycle. It may be used to peek or poke RTDB variables, control simulation execution, create signal generators, etc. An example use of a test script would be to simulate a hardware failure by replacing values read from I/O devices after the read stage, but before the models have run.
SimWB provides an APIs C programs, a custom real-time scripting language and Python (see Application Programming Interfaces (APIs)).
The Simulink model is an executable program produced by MATLAB/Simulink, which calls the proper API function so its execution can be dispatched by the scheduler process.
Application Programming Interface (API).
Users may write programs that interact with the simulation using a set of APIs (see Application Programming Interfaces (APIs)). These APIs allow the program to map to RTDB variables and manipulate them, as well as synchronize itself with the scheduler. This is different than the test script (see Test Script) or models. The test script and the models are bound firmly in the scheduling scheme, dispatched automatically in every simulation cycle after the inputs are read, whereas a user program will be started at the beginning of the simulation and may or may not synchronize itself with the cycle, depending on its needs.
SimWB can log RTDB item values in real-time to a data logger that may reside on the same system or on a separate host via a dedicated network interface. An API is supplied for registering with the message logging daemon and sending messages to the test system log (see Application Programming Interfaces (APIs)).
The logging processes support dynamic logging where logging of a specific data item can be turned on and off at run time to enable or disable logging for the point.
TODO: document how to configure a data logger on a separate host.
The main process is the scheduler, triggered by the Frequency-Based Scheduler (FBS). The “Simulation Cycle” corresponds to an FBS frame. The sequence of actions presented in the figure is provided by various other processes and is controlled by the scheduler via semaphores. See Scheduler Process for details about scheduler process execution.
The “Simulation Cycle” begins with the reading of inputs. This is carried out by several I/O tasks. The I/O tasks are dedicated processes that read or write to hardware devices. They cover all I/O boards currently supported by SimWB. See I/O Tasks for a description of these tasks.
Before running cyclically, the scheduler process loads the RTDB into shared memory and scans through it to identify I/O board mappings. Depending on these I/O board mappings, the scheduler will execute the I/O tasks needed for the specific points. For example, if a specific item is mapped in the RTDB to channel 3 on the first analog input board, the scheduler will start the I/O task that reads the analog input boards. Only the I/O tasks necessary to process the items in the RTDB are started for a specific test run. See Real-Time Database (RTDB) for more information.
Multiple boards of the same type are accessed by separate instances of the same process. For example, there will be as many instances of the analog input task ai64ss running as there are boards of that type in the system. To optimize performance, these instances can all run in parallel on different CPUs.
When the corresponding hardware device can be run at the speed of the simulation loop (analog input and output, digital input and output), the associated process will run as part of the simulation loop; that is, synchronous to the simulation loop.
When the device is too slow or is asynchronous by its nature (ARINC, AFDX, etc.), the input is performed by a combination of asynchronous processes that run at their own natural rate outside of the main simulation loop and place the data in an “asyncioin FIFO” (shared by all such asynchronous input processes), and a synchronous process (running at the beginning of each simulation cycle) that moves the FIFO values into the RTDB.
Execute (Optional) Test Script
This gives you the ability to manipulate the RTDB before every model execution step. It may be used to peek/poke RTDB variables, control simulation execution, create signal generators, etc. See Test Script for more information.
Execute Models
This is the core action of SimWB.
SimWB supports parallel multi-model execution (if CPU resources permit parallelism) as well as imposed sequential execution (task ordering). Models may communicate via the RTDB.
Each model is a process. This is typically a Simulink executable, compiled by MATLAB’s Simulink Coder from a Simulink model, but may also be created from legacy software. See Simulink Model for more information.
The same considerations as Read Inputs apply concerning the selection of the required I/O tasks, possible multiple instances of these tasks and servicing synchronous devices.
A test run is a cyclical execution of software simulation models in real-time. It includes the ability to connect the inputs and outputs of the models with external hardware and to interact via program and/or operator interfaces with the model signals and parameters.
The cyclical execution is dispatched by Concurrent’s Frequency-Based Scheduler (FBS). For complete details about FBS, refer to RedHawk Linux Frequency-Based Scheduler (FBS) User Guide, Concurrent publication number 0898005.
A test is defined by the collection of specific simulation resources available on the system, such as:
• a signal database (RTDB) that defines the input and output of models as well as their mapping to the hardware boards
• Simulink or custom-written models
• optional user written test scripts written in the SWm, SWs, C or Python languages
The first step in creating a test is to define the inputs and outputs into the simulation by creating an RTDB.
TODO: this is the legacy approach. Rewrite this to refer to the Toolkit for MATLAB
Once the RTDB has been created, the Simulink models can be created or ported to SimWB by including in the model Concurrent S-function blocks to access specific RTDB variables as shown in the illustration:
The Simulink model is then imported into the SimWB framework via the Simulink Models... form and an executable program is generated.
The test is then created and configured by assigning the RTDB, model executables and optional user script to it. The test then appears in the list of available tests and is ready to run.
The SimWB scheduler process is the process that initiates, monitors, and dispatches SimWB process execution. Processes are executed according to their run position in the simulation loop. The scheduler itself runs cyclically and its execution can be dispatched through several mechanisms
• RCIM RTC interrupt via the Concurrent FBS
• RCIM ETI interrupt via the Concurrent FBS
• External FBS configuration to which it can attached itself
The scheduler is started by the Control Center when the user wants to run a test, getting the test and session name as command-line arguments.
The scheduler always runs on CPU 1 with a priority of 99 in the FIFO scheduling class.
The test defines which particular RTDB, script, user model and Simulink model resources to use. Each resource is identified by its type and a unique name.
A test can be run with only an RTDB defined. In this case, only the I/O processes associated with signals in the RTDB will be run.
On startup, the scheduler process is given the test and the session IDs for the test to be run. A test session is a single instance of a test that defines simple configuration parameters such as frame rate, test duration and allowable overrun count. Given the test and session ID, the scheduler process identifies which RTDB to load and which script, user, and RTW programs to run.
The scheduler process will load the signal data base into shared memory as the RTDB. Thus, only a single instance of the RTDB can be loaded into memory at any time.
Once the RTDB is in memory, the scheduler process will scan through the RTDB to identify I/O board mapping and execute the I/O task (see I/O Tasks) needed for the specific points. For example, if we mapped a specific item in the signal database to channel 3 on the first analog input board, the scheduler process will start the task that reads that analog input board. This means that only the I/O tasks necessary to process the item in the RTDB are started for a specific test run.
In some cases, more than one instance of a task is needed to satisfy the I/O mapping requirements. In order to minimize execution time of the I/O processes, access to multiple boards of the same types are done by separate instances of a same process. For example, there will be as many instances of the analog input task ai64ss running as there are AI64SS boards in the system so that they can all run in parallel on different CPUs.
Some processes are always started regardless of hardware I/O mapping. Those processes such as the client logging processes (logsend, logtxin, logtxout) and asyncioin do not have any boardid keyword associated since they must always be running during a test run.
Executing the User Script, User Models and Simulink Models
The scheduler process will execute the user script, user models, and Simulink models.
Once the scheduler has completed its initialization it will program the FBS scheduler (or other scheduler) at the frame rate defined for the test session. It will then run periodically and pause upon execution of the fbswait() call.
Once it resumes after an fbswait() call, the scheduler checks the completion status of the processes executing at the last stage of the test cycle. Any task that has not completed by that time will trigger an overrun condition.
The scheduler then sets the initial count for the scheduling semaphores and resumes all stage one processes.
Once a test is complete, the scheduler kills all the processes it has started at initialization time, updates the session results file and exits the system.
The cyclical execution frame is divided into sub cycles or slices during which the individual processes must run. The slices are numbered from 1 to n and called in order, 1 corresponding to the processes that run first in the frame. Every process that runs during slice n must finish before the processes scheduled at order n+1 are started. Order 0 corresponds to asynchronous processes that run independent of the frame scheduling. Those processes are started by the scheduler but are not hooked into the synchronous scheduling.
The physical input processes run first followed by the script program in order 2, the models in order 3 and the physical output processes last in the frame. Since the script process runs second in the frame after the input phase, it is guaranteed that all the inputs will have been read from the hardware and therefore the script process will always have the current values of input for the frame.
This synchronous scheduling of the process is implemented by counting semaphores. The scheduler creates the semaphores at initialization time and assigns them to the individual processes according to their execution order. The scheduler also sets the initial count on the semaphores based on the number of processes to run during a particular slice. Whenever a process finishes its processing for the current slice, it decrements the semaphore count of the semaphore assigned to the next order. When the count reaches 0, all the processes waiting on that semaphore resume execution. Also, in order to prevent itself from running again at the end of its cycle, the process increments the count on the semaphore that triggers it own execution.
Processes running last in the execution frame do not update the next order semaphore but simply set a completion status that is examined by the scheduler process.
The scheduler process itself is scheduled by the FBS mechanism at a period that is defined by the session parameter (frame rate). Whenever resumed by FBS, the scheduler sets the correct count on all semaphores and resumes all the order 1 processes by setting the order 1 semaphore to 0. At each frame, the scheduler also checks the completion status of all the tasks running at the last order. An overrun condition is triggered whenever any task at the last order has not completed execution at the end of the frame.
It is worthy to note that the overrun condition can only be detected because some tasks running at the last order did not complete in time. However, this does not mean that this process caused the overrun. Its execution might have been delayed by any of the processes that must run at a lesser order before it.
TODO: Insert flow graph diagram showing semaphore transitions.
Scheduler Start
The scheduler process is started by the configuration server (cfgsrv) when the user requests a test be run in the Control Center or via an HMI display. The test ID and session ID are included as arguments. A test can also be started from the command line by running (on the real-time host while located in /usr/local/ccursim/bin):
# ./sched -t testid -s sessionid
The scheduler is loaded in memory only for the duration of a test. The scheduler process exits whenever the test completes or the test is aborted by a user program or the user.
Scheduler Stop
The scheduler stops under any of the following conditions:
• A test can be stopped by a script program via the appropriate API call. The completion status is passed into the call and is reflected as the result of the test.
• A test can run to completion if a finite duration was defined for the test session. The scheduler will calculate how many frames need to be run and exit. The successful completion status will be reflected in the test session results file. Possible completion status for a test are defined in the simerrors.h header file.
• A test can be aborted by simply sending the SIGKILL signal to it. This is a user abort.
• If the scheduler accumulates an overrun count past what has been defined as acceptable for a particular test session, the scheduler stops the test with an overrun completion status.
• I/O tasks may also abort the test when an irrecoverable hardware failure is found during a test run.
On test termination, the scheduler kills all the processes started at initialization time.
Pre- and Post-process
Scheduler pre- and post-processes can be optionally written by the user in any programming language (C, perl, etc.).
The scheduler pre-process name is /usr/local/ccursim/bin/schedPreProcess. The pre-process is run by the scheduler after the scheduler has loaded the RTDB in memory but before any I/O tasks or models are started.
When schedPreProcess is not found in /usr/local/ccursim/bin, the scheduler will look for it in the directory corresponding to the test being run. See Tests.
The pre-process must exit with return code 0. Any other code signals an error to the scheduler, causing it to abort the test run.
The scheduler post-process name is /usr/local/ccursim/bin/schedPostProcess. The post-process is run by the scheduler after all models and I/O tasks have been stopped.
When schedPostProcess is not found in /usr/local/ccursim/bin, the scheduler will look for it in the directory corresponding to the test being run. See Tests.
The post-process must exit with return code 0. Any other code signals an error to the scheduler.
Scheduler Periodic Run
As mentioned above, once the scheduler process has completed its initialization, it will program the FBS scheduler at the frame rate defined for the test session. It will then run periodically and pause on the execution of the fbswait() call.
Once resumed by the fbswait() call, the scheduler checks the completion status of the processes executing at the last order. Any task that has not completed by that time will trigger an overrun condition.
The scheduler then sets the initial count for the scheduling semaphore and resumes all the order 1 processes.
Once a test is complete, the scheduler kills all the processes it has started at initialization time, updates the session results file and exits the system.
The I/O tasks are dedicated processes that read from or write to hardware devices.
By keeping the separation between I/O tasks, models, and scripts, the user can write his application models and scripts transparently. The peculiarities of the hardware devices connected to the system will not affect his application. This independence also allows for the RTDB items to be remapped to different hardware devices without affecting the models and scripts running under SimWB.
When the corresponding hardware device can be run at the speed of the simulation loop (doing analog or digital input and output), the associated process will run synchronously as part of the simulation loop. Synchronous I/O tasks typically read or write their inputs or outputs once per cycle. They are divided into input and output tasks since those run during different cycles of the simulation loop.
Every synchronous I/O tasks is implemented so that it will drive a single instance of a board of a particular type. When there are multiple instances of the same hardware board in the system, multiple instances of the I/O tasks are run. Each instance will run on a designated CPU, allowing optimization of CPU and I/O bus bandwidth as access to the device can occur in parallel.
In the default configuration, every synchronous I/O task will run at priority 99 under the FIFO scheduling class. I/O tasks are programmed so that they minimize use of blocking system calls, and thus are not preempted by the OS. This limits the overhead of context switches, reducing execution time for the tasks. By running at priority 99, it is insured that the task will run its cycle in one short run without being interrupted by the OS or any other task running at a higher priority.
When the device is too slow or asynchronous by its nature (ARINC, AFDX, etc.), the process runs at its own natural rate outside of the main simulation loop. Examples of asynchronous devices are serial, 1553, AFDX, Arinc 429, CAN, and FlexRay.
Most asynchronous I/O tasks are implemented as multi-threaded processes where separate threads are used for input and output. This is device dependent and the design of an asynchronous I/O tasks is usually predicated by the functionality of the device.
Even though asynchronous I/O devices are driven by their respective device, the consistency of the RTDB must be maintained. They cannot update the RTDB at random as this could cause a model or script to work with two different values in the same RTDB item. The same applies to the output. They need to be gathered in one shot during the output cycle so that only one value of a particular output item will be used at a particular time.
Therefore, all asynchronous I/O tasks queue their RTDB updates through an asynchronous I/O input FIFO queue. The FIFO queue is processed during the simulation loop input sub-cycle.
TODO: insert diagram
A test is a collection of resources that defines a configuration that can be run under the scheduler. The resources needed to define a test are:
A session is an instance of executing a test. Test sessions can be created before they are executed using the Control Center and run repeatedly. They can also be created automatically each time a test is run.
Each session saves its own logging data. See Tests. Each time the session is run, the data is overwritten.
Initial conditions can be specified per session run to define RTDB item values (such as I/O points and model parameters) at the beginning of the run. Initial conditions can also specify what RTDB items are logged and how often. The initial conditions are selected from a set of initial conditions created by the user. A default set of initial conditions is automatically created for each test. See Initial Conditions....
Each individual item defined in the RTDB can be logged at a configurable period. Whether an item is logged and the period at which it is logged is defined in the RTDB. Whenever a CVT value Alternate value, or real-time flag associated with the item changes, the item is placed in a data logger record for the specific frame under execution.
A record in the binary data file consists of a fixed length header (which is a bitmask indicating which items have values in the record) followed by a collection of value fields, one field for every RTDB item that has a value in the record. The following data is recorded per item:
• CVT value (logged as the ‘C’ type defined in the RTDB)
• Alternate value (logged as the ‘C’ type defined in the RTDB)
• Raw value (hardware-specific format)
For a double item with an int raw type, the value field would be 8+8+4+1=21 bytes. The length of the value field in the record is variable based on the item data types.
The data logging subsystem has a client/server architecture. The real-time host builds records of item value changes at the frame rate of the simulation loop. These records are sent to the data logging server process (logsrv) via a network connection.
The data logging server can run on a separate system, which helps when the data logging load is so heavy that it can impact the real-time performance of the real-time host. The load can be significant, depending on the amount of data logged, the speed at which it can be logged, and the frequency of change in the values of items.
For example, a simulation that runs at 1 millisecond with 2000 RTDB items to log that change every frame will generate 21*2000*1000=42 MB/s. SimWB has achieved in a separate data logger system configuration a sustained data rate of 250 MB/s. Such a data rate requires a RAID subsystem that can maintain that rate.